Stock compensation plans of various types are a common method of compensation for valued employees of successful companies. Generally, these plans come in the form of Restricted Stock or Restricted Stock Units (RSUs), Incentive Stock Options, Non-Qualified Stock Options, or Employee Stock Purchase Plans. Receiving these corporate benefits is excellent for wealth accumulation, but it’s essential to understand how taxes are generated from these sources of income.
Definitions:
Grant Date: The date on which a company issues an equity compensation plan to an employee
Vesting Date: The date on which an ISO bearer may legally exercise their options or on which they receive their restricted stock units
Exercise Date: The date by which an employee uses stock options to purchase company stock
Vesting Schedule: A schedule by which an employee receives their equity compensation
Offering Period: The length of time after the grant date in which a stock option holder may exercise their options
Restricted Stock Units (RSUs):
These are stock units that are granted to an employee for the completion of certain performance milestones. This is the most straightforward form of equity compensation. These stock units are given to the employee as income on the shares’ vesting date. While employers usually withhold taxes on income, they do not adequately account for the vesting of RSUs each year which can lead to a hefty tax bill come tax time. The market value of the shares determines the tax of RSUs on the vesting date. Usually, the employee will immediately sell RSUs upon vesting to cover the tax bill they create. It is important to note that for vested RSU shares to qualify to be taxed at the preferential capital gains tax rates, they must be held for a year or longer after the vesting date. It is also important to note that the vesting of RSUs is considered income and is included on box 1 of your W-2.
Here is an example to outline how RSUs work and are taxed. Let’s say that Julian is granted 5,000 RSUs that vest at a rate of 20% yearly, and the market price at the grant date is $60 a share. The stock price the next year is $65. This means that in the first year of the stock vesting, Julian will show and be taxed on an additional $65,000. This amount will be shown on his W-2 box 1 wage. Let’s say the stock price stays at $65 for the remaining vesting schedule. This means that for five years in a row, Julian will show an additional $65,000 of income on his W-2 but not actually receive cash for the income (this is why many people immediately sell some shares to cover the tax liability created from the vesting of the shares). Then in year six, if Julian sells all 5,000 of the shares when the share price is $75 a share, he will recognize a $50,000 long-term capital gain (Basis of 5,000*$65 = $325,000 sell price of 5,000*$75 = $375,000). Please see Exhibit 1 below for a visualization of this example.
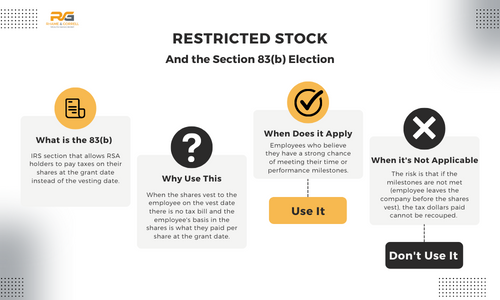
A similar equity compensation tool to RSUs is RSAs. This stands for Restricted Stock Awards and looks and acts very similarly to RSUs with a couple of key differences. RSAs are also eligible for the 83b election, which is a tax planning tool that allows you to make a tax payment at the grant date instead of the vesting date. For more information regarding Restricted Stock, RSAs, and the 83(b) election, please see our article on this topic.
Incentive Stock Options (ISOs) & Non-Qualified Stock Options (NQSOs):
These stock options tend to be more complex in nature. An ISO is a right an employer gives an employee to buy stock in the company at a later date for a price equal to or more than the stock’s market value at the time of the initial agreement. ISOs have a required vesting period of two years and a hold period of more than one year before they can be sold at the preferential capital gains tax rates. If an ISO is not held for more than a year past the exercise date and two years from the grant date, it will be subject to ordinary income tax rates. It is important to note that ISOs terminate three months after employment with a company ends, so if you were to leave a company, your ISOs would end. There is also favorable tax treatment with ISOs. There is no tax when the options are granted or exercised. Tax is only realized when the stock is sold, and most likely, it will be at the capital gains tax rates. There is an Alternative Minimum Tax (AMT) implication to consider with ISOs. In the year the ISO is exercised, there will be a gain created for AMT. This gain will be the difference between the stock price at the grant date and the price at the exercise date. This AMT number will only impact an employee when they are highly compensated and have substantial options awarded. Please note that you can only exercise $100,000 in ISOs annually.
Here is an example to outline how ISOs work and are taxed. Let’s say Becky is granted an ISO to purchase 2,000 shares of her company’s stock at the current market price of $20. The stock vests two years after the ISO was granted to Becky when her company’s stock price has risen to $25 a share. Becky then exercises 1,000 of the stock options and purchases 1,000 shares of the stock for $20,000 (1,000*20). That year on Becky’s tax return she will need to show a $5,000 gain for AMT purposes (1,000*25 = 25,000 minus 1,000*20 = 20,000). Then after Becky has held the stock for a year, she sells it when the price is $30 a share, and she will show a long-term capital gain of $10,000 (1,000*$30 = $30,000 minus 1,000*$20 = $20,000). This is the most tax-efficient way for Becky to exercise her options. If Becky were to sell the shares before she held them for one year after exercising her options, then the $10,000 will be counted as ordinary income to her and taxed at a higher tax rate.
Please see exhibit 2 below for a visualization of this example.
NQSOs are more common and simple stock options than ISOs. NQSOs like ISOs give an employee the right to purchase a set number of shares within a designated timeframe at a predetermined price. Like ISOs, the predetermined price must be the same as or greater than the market price on the grant date of the NQSOs. The difference in taxation between ISOs and NQSOs comes into play when the stock options are exercised. While the difference in stock appreciation between the exercise and market price is shown as an AMT adjustment for ISOs, they are fully taxable as ordinary income and subject to payroll taxes for the employee and employer with NQSOs.
Let’s revisit Becky’s example and assume that instead of her options being qualified ISOs, they were NQSOs. This means that at the grant date, ISOs and NQSOs look identical. Then, in year 3 when Becky exercises 1,000 shares for $20 a share when the market price is $25 a share, she will have to pay taxes on the $5,000 appreciation (1,000*$25 = $25,000 minus 1,000*$20 = $20,000). This $5,000 appreciation will be shown on Becky’s W-2. Please see exhibit 3 below for a visualization of this example.
Employee Stock Purchase Plans (ESPPs):
ESPPs are taxes similarly to ISOs. They are limited to $25,000 exercised annually, and the employer can only give a maximum of 15% discount on the stock. They have the same holding period requirements as ISOs in that they must be held for at least a year after being exercised to qualify for the preferential capital gains tax rates.
.png?width=2404&height=783&name=Chuchi%20Perez%20(1).png "Chuchi Perez (1)")